

how to create a scatter plot to find the outlier in dataset in python
Finding outliers in dataset using python
![]()
In this article, we will use z score and IQR -interquartile range to identify any outliers using python
Jupyter notebook is available at- https://github.com/arshren/MachineLearning/blob/master/Identifying%20outliers.ipynb
What is an outlier?
An outlier is a data point in a data set that is distant from all other observations. A data point that lies outside the overall distribution of the dataset.
What are the criteria to identify an outlier?
- Data point that falls outside of 1.5 times of an interquartile range above the 3rd quartile and below the 1st quartile
- Data point that falls outside of 3 standard deviations. we can use a z score and if the z score falls outside of 2 standard deviation
What is the reason for an outlier to exists in a dataset?
An outlier could exist in a dataset due to
- Variability in the data
- An experimental measurement error
What is the impact of an outlier?
causes serious issues for statistical analysis
- skew the data,
- significant impact on mean
- significant impact on standard deviation.
H o w can we identify an outlier?
- using scatter plots
- using Z score
- using the IQR interquartile range
Using Scatter Plot
We can see the scatter plot and it shows us if a data point lies outside the overall distribution of the dataset
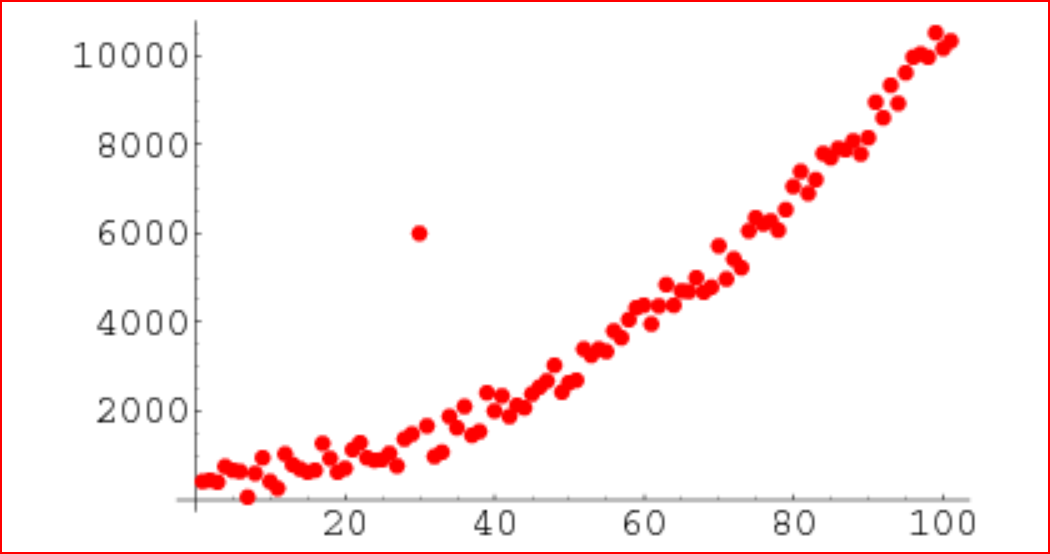
Scatter plot to identify an outlier
Using Z score
Formula for Z score = (Observation — Mean)/Standard Deviation
z = (X — μ) / σ
we first import the libraries
          import numpy as np
import pandas as pd
we will use a list here
dataset= [10,12,12,13,12,11,14,13,15,10,10,10,100,12,14,13, 12,10, 10,11,12,15,12,13,12,11,14,13,15,10,15,12,10,14,13,15,10] we write a function that takes numeric data as an input argument.
we find the mean and standard deviation of the all the data points
We find the z score for each of the data point in the dataset and if the z score is greater than 3 than we can classify that point as an outlier. Any point outside of 3 standard deviations would be an outlier.
          import numpy as np
import pandas as pd
outliers=[]
def detect_outlier(data_1):                  threshold=3
              mean_1 = np.mean(data_1)
              std_1 =np.std(data_1)                                  for y in data_1:
              z_score= (y - mean_1)/std_1
              if np.abs(z_score) > threshold:
              outliers.append(y)
              return outliers
we now pass dataset that we created earlier and pass that as an input argument to the detect_outlier function
          outlier_datapoints = detect_outlier(dataset)
print(outlier_datapoints)
output of the outlier_datapoints
Using IQR
IQR tells how spread the middle values are. It can be used to tell when a value is too far from the middle.
An outlier is a point which falls more than 1.5 times the interquartile range above the third quartile or below the first quartile.
we will use the same dataset
step 1:
- Arrange the data in increasing order
- Calculate first(q1) and third quartile(q3)
- Find interquartile range (q3-q1)
- Find lower bound q1*1.5
- Find upper bound q3*1.5
- Anything that lies outside of lower and upper bound is an outlier
Fist sorting the dataset
sorted(dataset) Finding first quartile and third quartile
q1, q3= np.percentile(dataset,[25,75]) q1 is 11 and q3 is 14
Find the IQR which is the difference between third and first quartile
iqr = q3 - q1 iqr is 3
Find lower and upper bound
          lower_bound = q1 -(1.5 * iqr)
upper_bound = q3 +(1.5 * iqr)
lower_bound is 6.5 and upper bound is 18.5, so anything outside of 6.5 and 18.5 is an outlier.
how to create a scatter plot to find the outlier in dataset in python
Source: https://medium.com/@dark.coding/finding-outliers-in-dataset-using-python-ffd2f585589c
Posted by: kohndeabinder.blogspot.com
0 Response to "how to create a scatter plot to find the outlier in dataset in python"
Post a Comment